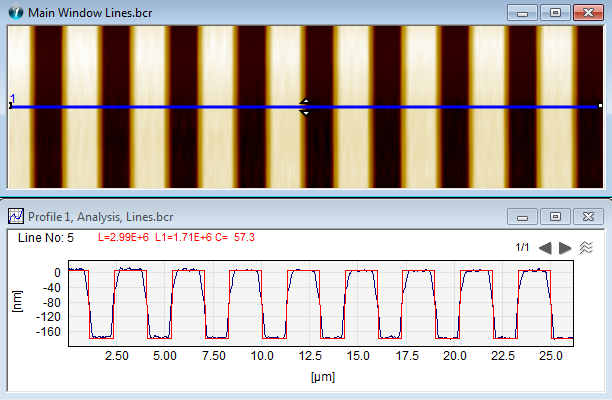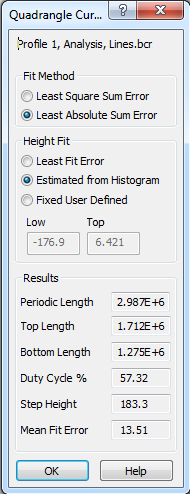
To analyze how well a profile matches a quadrangle, click Square Wave in theAdvanced Fitting Panel of a Profile Analyze Ribbon tab. This will add a fitted quadrangle to the profile and open a dialog where the numerical results of the fits is displayed and where some fitting parameters can be set.


This function is part of the Calibration Module and is very important for evaluation of many nano or micro fabricated structures and is part of the SPIP calibration module. It can also supported by the Batch Processor through the functions Quadrangle Curve Fit.
The fitted result contains the Periodic Length, which is separated into the Top Length and the Bottom Length. The ratio between the Bottom length and the Top length gives the Duty Cycle. And the Step Height is the difference between the top and bottom of the fitted quadrangle.
The Quadrangle Fit Method can be set to minimize the sum of the square errors or the sum of the absolute errors, the latter provides typically the most intuitive results as it is not affected so much by outliers. The height levels of the quadrangle can be defined by a least error fit (sum of square errors or absolute errors) or the height distribution histogram, which is the default. Alternatively the height values can be set manually.